Bootstrap sampling distributions ("what if we ran the experiment many times...")
what_if.RdEstimate the sampling distribution of a sample statistic or regression coefficient from a linear model (lm)
what_if(
  data,
  variable = NULL,
  model = NULL,
  stat = NULL,
  group = NULL,
  focus = NULL,
  experiments = 100L,
  sample_size = 100L,
  plot = TRUE,
  p.values = FALSE,
  seed = sample.int(.Machine$integer.max, 1),
  ...
)
Arguments
| data | data of class |
|---|---|
| variable | a continuous variable from the data frame. Only relevant if using `stat` (to boostrap a sample statistic) |
| model | a model or formula, e.g., `y ~ x1 + x2`. Use this to boostrap a linear model |
| stat | an R summary statistic function (e.g., `mean()`, `median()`, `max()`, `sd()`) entered as a string (e.g., "mean", "median", "max", "sd") |
| group | categorical grouping variable from |
| focus | an independent variable from |
| experiments | number of experiments, i.e. runs of the boostrap sampler (defaults to 100) |
| sample_size | sample size of each experiment (defaults to 100) |
| plot | plot the sampling distribution of the regression coefficient (defaults to TRUE) |
| p.values | plot the cumulative distribution of p-values and report the number of significant results (defaults to TRUE) |
| seed | random number generator seed |
| ... | additional arguments to adjust the plots |
Value
ggplot object if plot = TRUE, otherwise a data.frame
Author
Lawrence R. De Geest
Examples
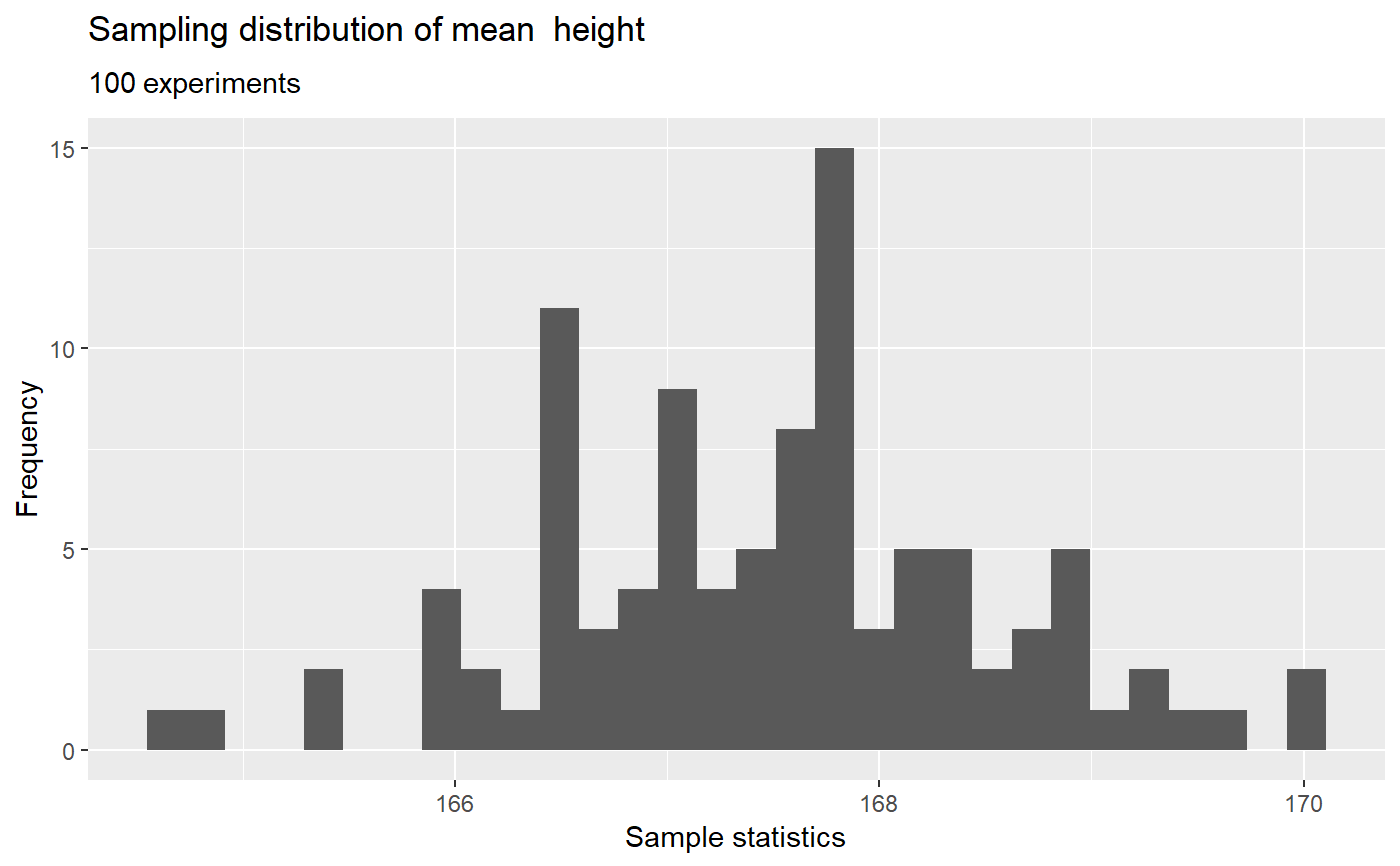
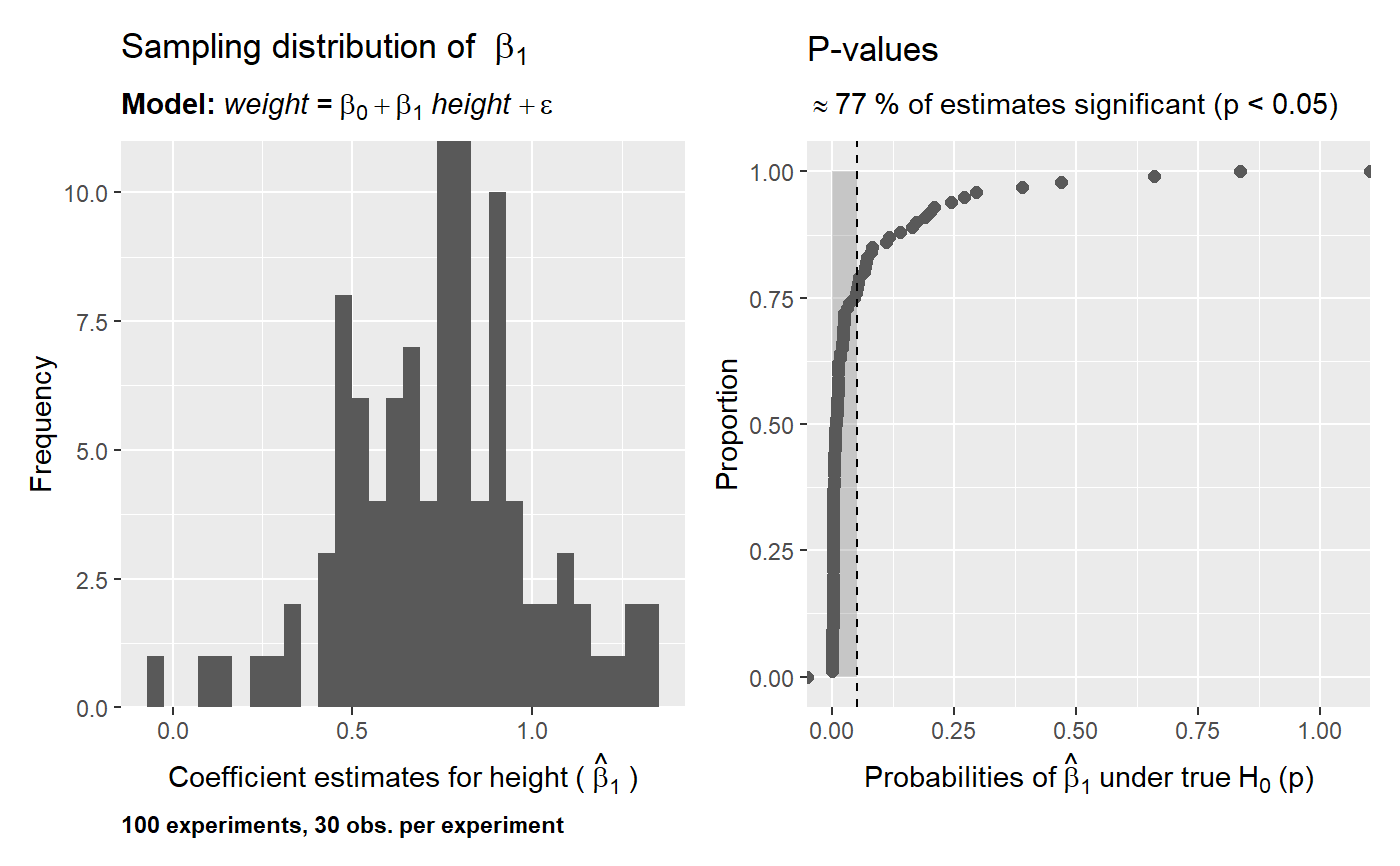
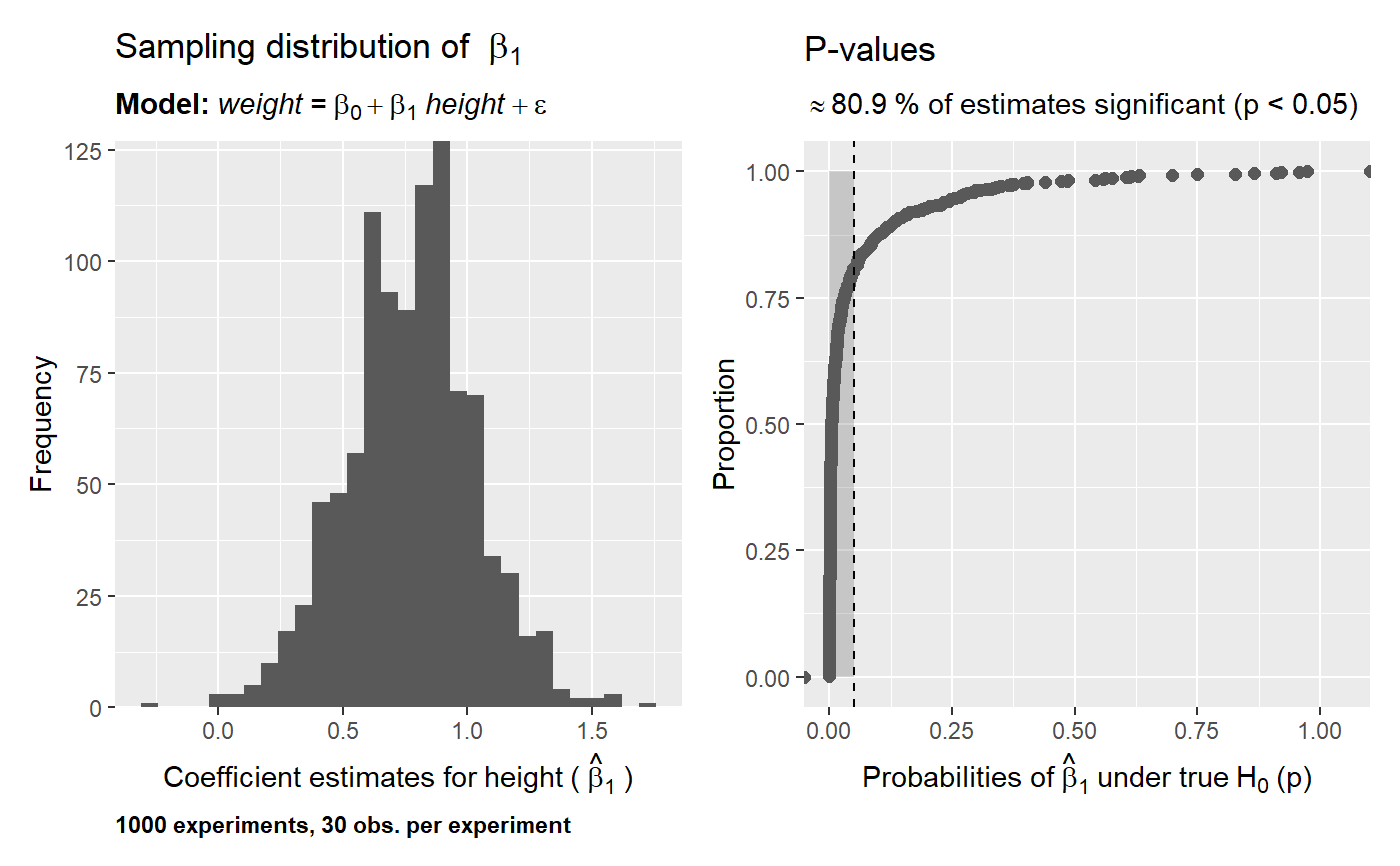
# using the nhanes data data("nhanes", package = "SuffolkEcon") # sampling distribution of the mean of height what_if(data = nhanes, variable = height, stat = 'mean')# sampling distribution and p-values for lm(formula = weight ~ height, data = nhanes) what_if(data = nhanes, model = weight ~ height, sample_size = 30, experiments = 100, p.values = TRUE)# increase the number of experiments what_if(data = nhanes, model = weight ~ height, sample_size = 30, experiments = 1000, p.values = TRUE)


