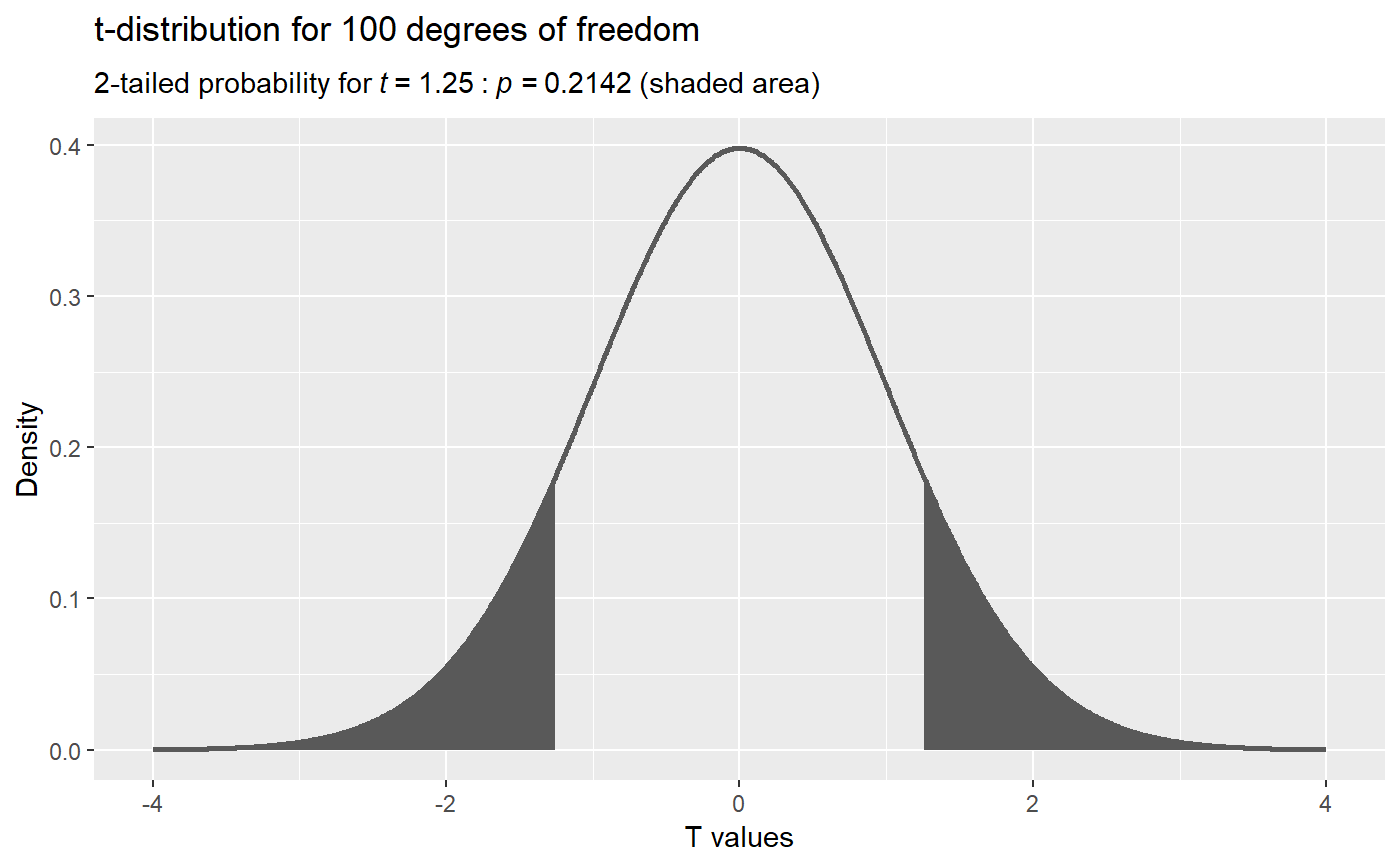
Plot t-distribution and visualize two-tailed p-value for a given t-statistic and degrees of freedom
plot_t_value.RdPlot t-distribution and visualize two-tailed p-value for a given t-statistic and degrees of freedom
plot_t_value(t_value, dof, fill = "grey35", color = "grey35", alpha = 1)
Arguments
| dof | degrees of freedom |
|---|---|
| fill | fill of the shaded area underneath the distribution for a given t-value. Defaults to "grey35" (ggplot2 default) |
| color | color of the outline of the kernel density. Defaults to "grey35" (ggplot2 default) |
| t-value | a value from the Student's T distribution |
Value
ggplot object
Note
add switch to plot standard normal and calculate p-values instead of t-distribution
Author
Lawrence R. De Geest
Examples
# plot t distribution for 100 degrees of freedom, then calculate and shade-in the p-value for t = 1.25
plot_t_value(t_value = 1.25, dof = 100)