Plot a one-dimensional, user-defined function
plot_function.RdPlot a one-dimensional, user-defined function
plot_function(
  f,
  lower,
  upper,
  derivative = FALSE,
  optimize = FALSE,
  maximum = FALSE,
  roots = FALSE,
  optim = FALSE,
  ...
)
Arguments
| f | a single-line function |
|---|---|
| lower | an integer indicating the lower bound |
| upper | an integer indicating the upper bound |
| optimize | optimize the function and plot the optimum and FOC (defaults to FALSE). If TRUE it defaults to finding the global minimum. Set |
| roots | find and plot the roots over the given domain (defaults to FALSE) |
| optim | use |
| ... | additional arguments passed to |
| maximize | if |
Value
ggplot object
Author
Lawrence R. De Geest
Examples
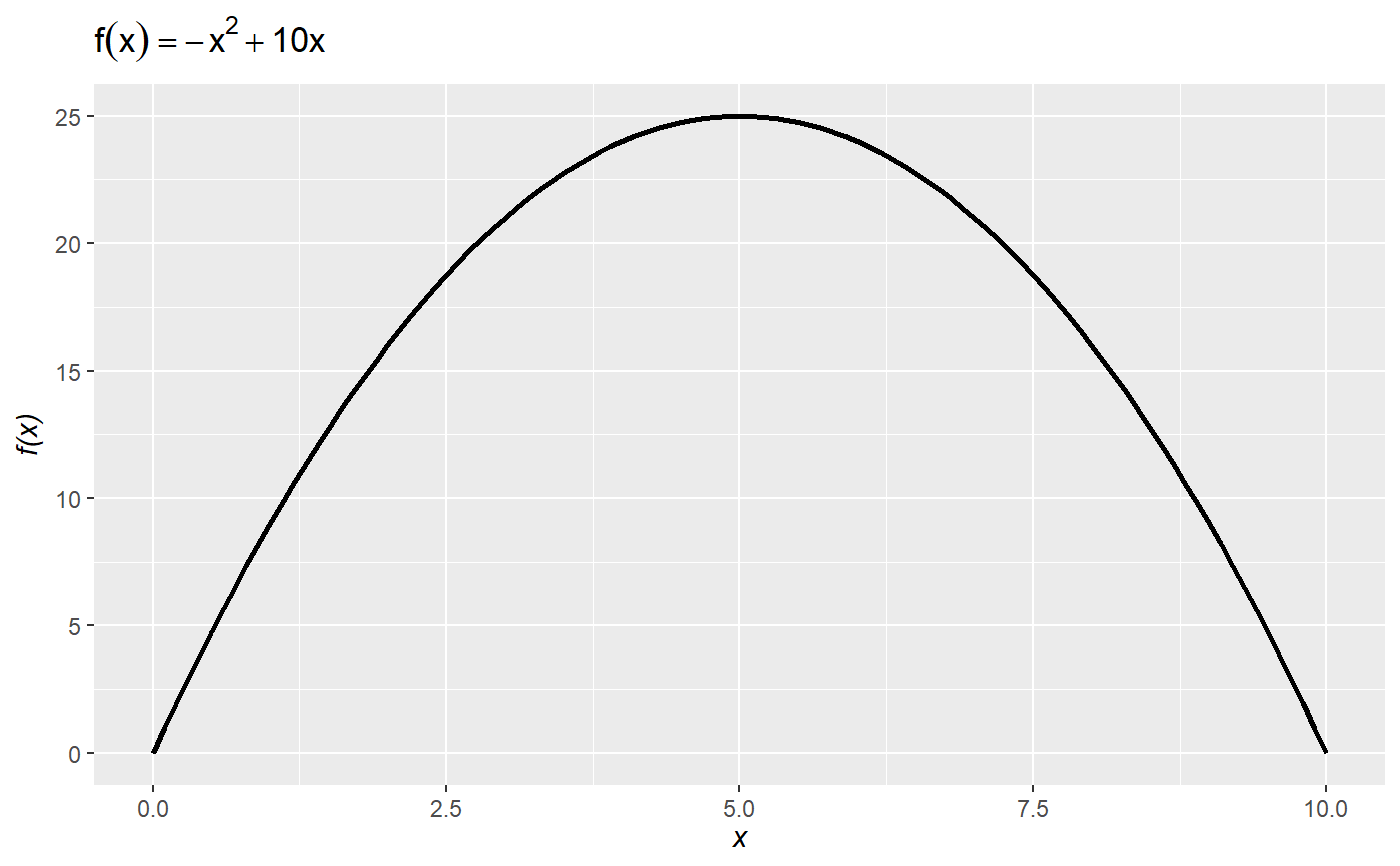
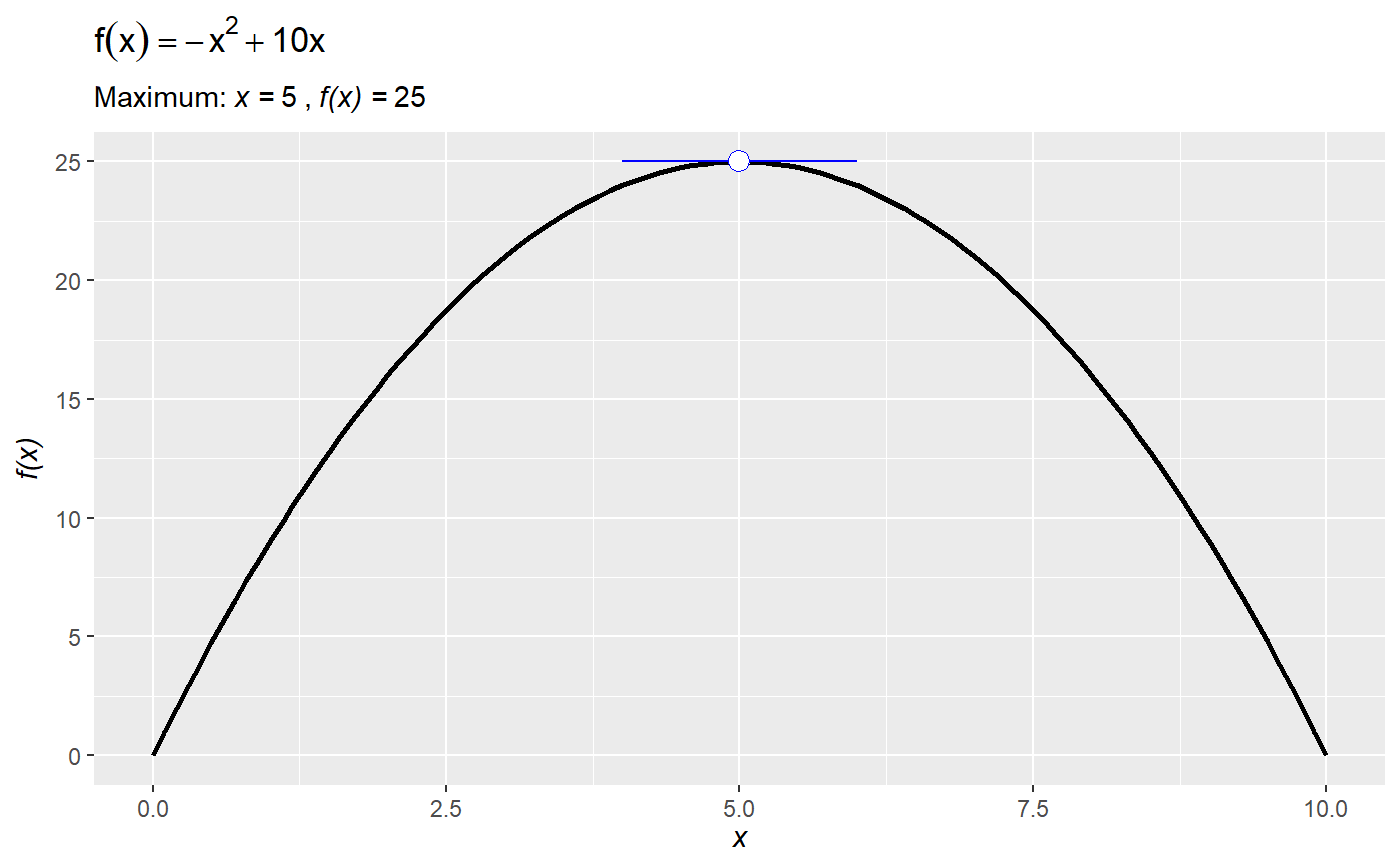
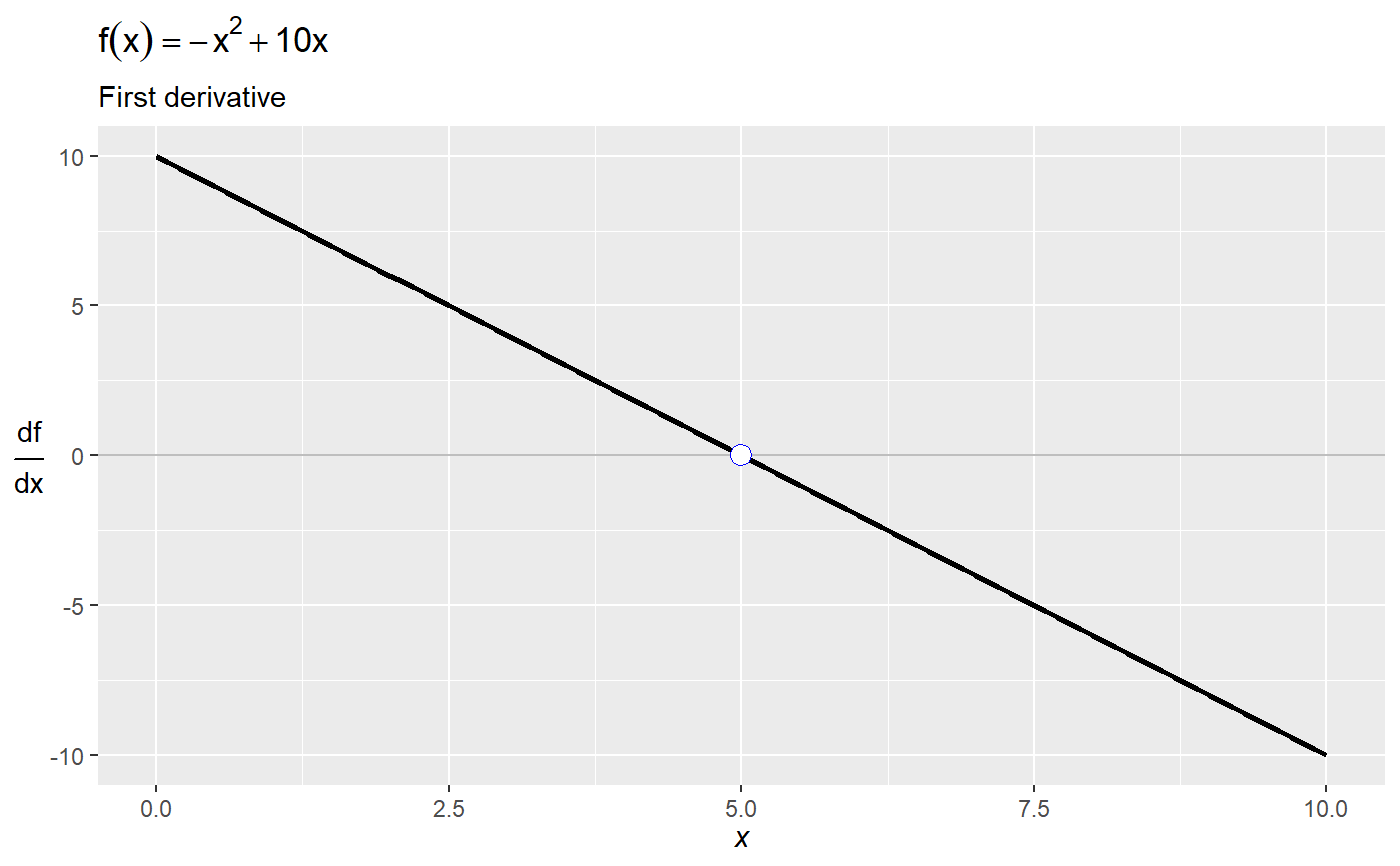
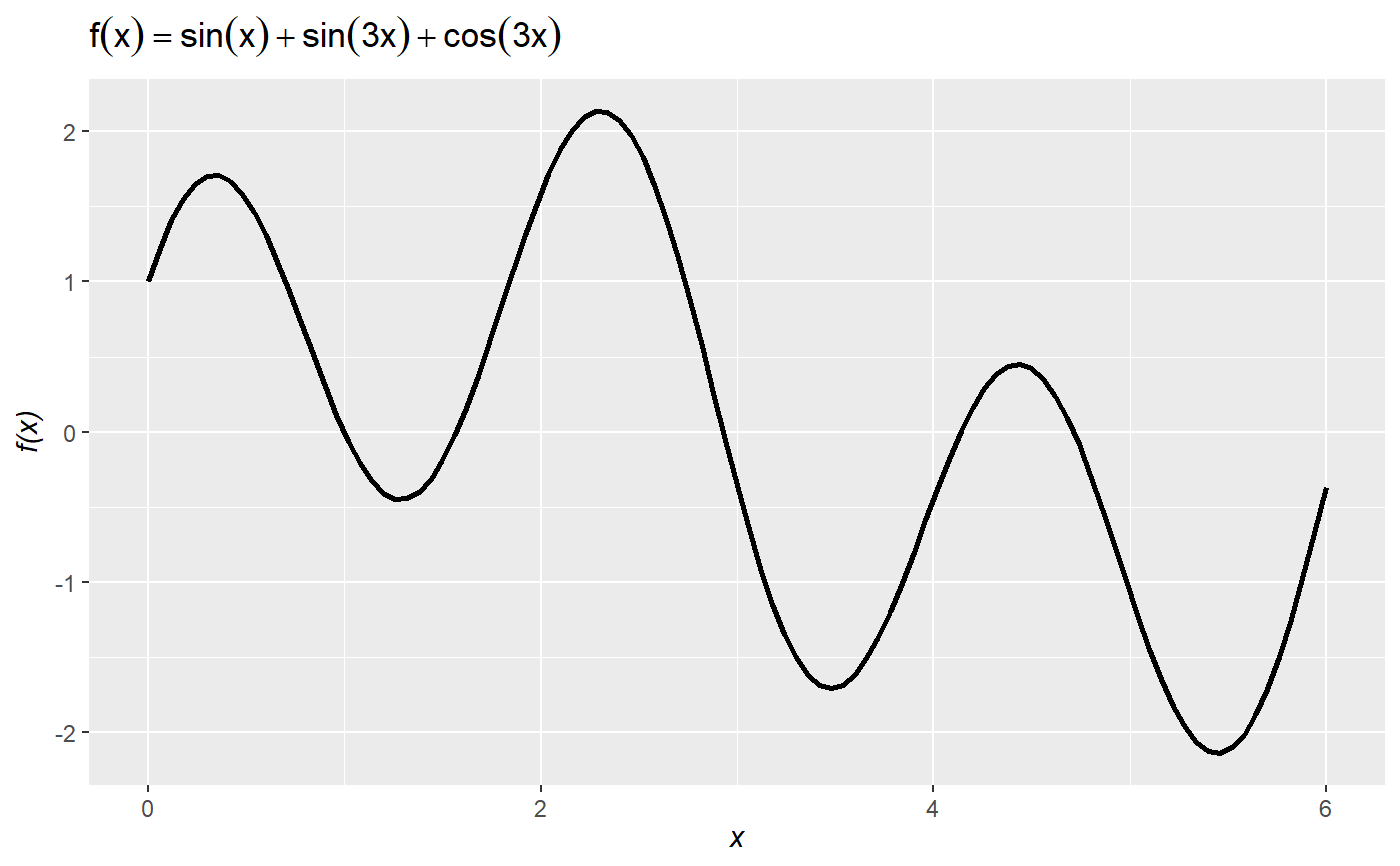
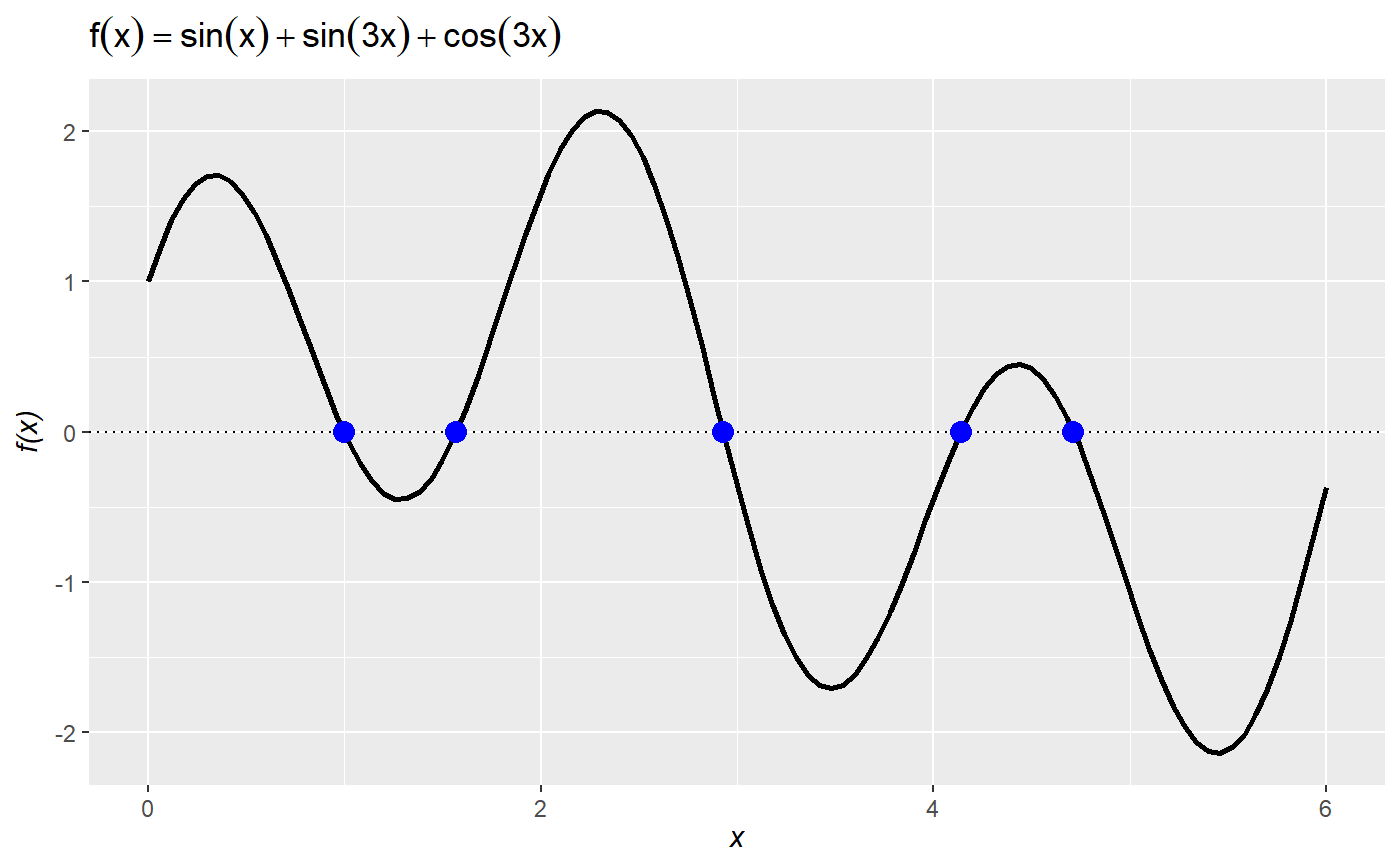
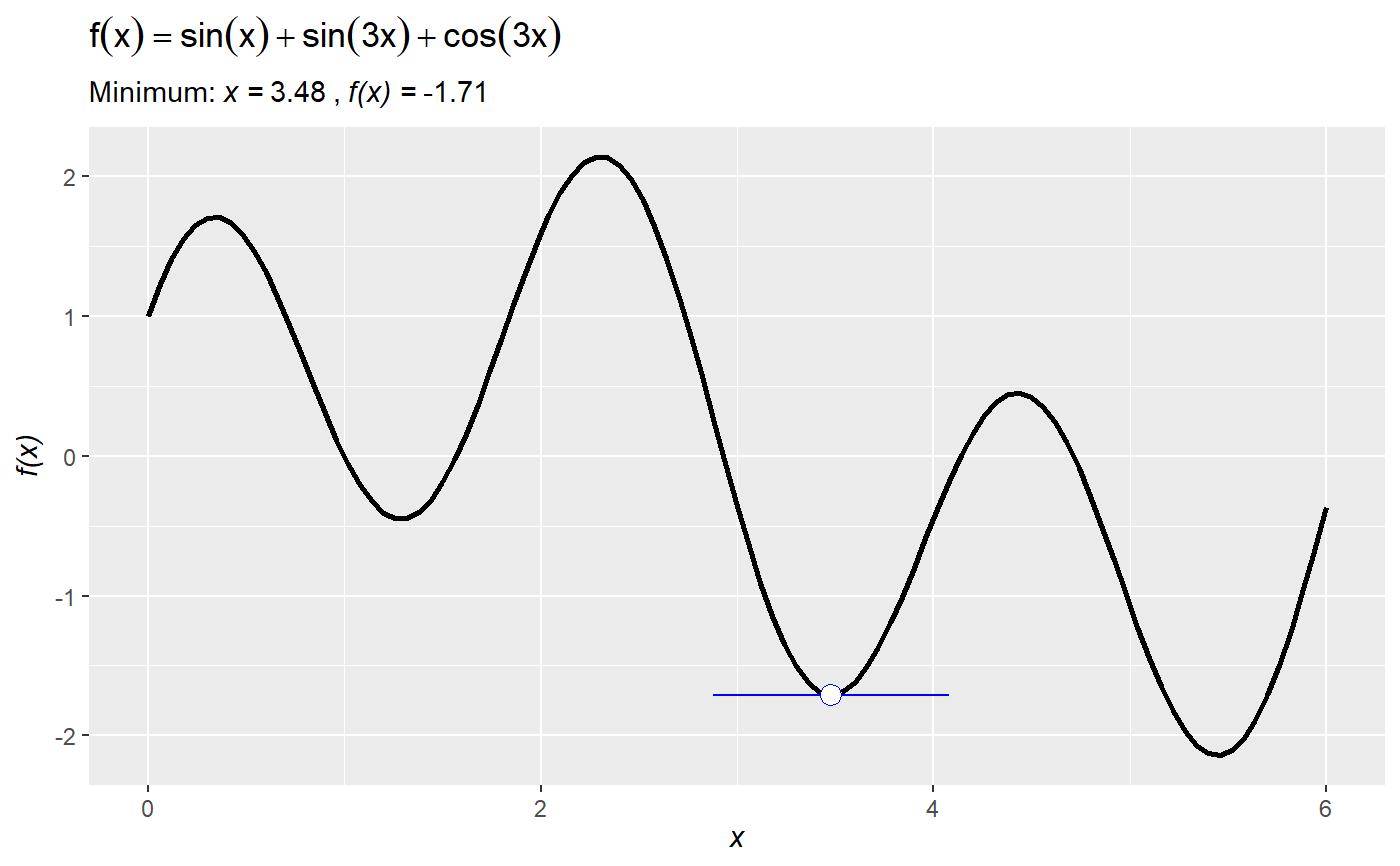
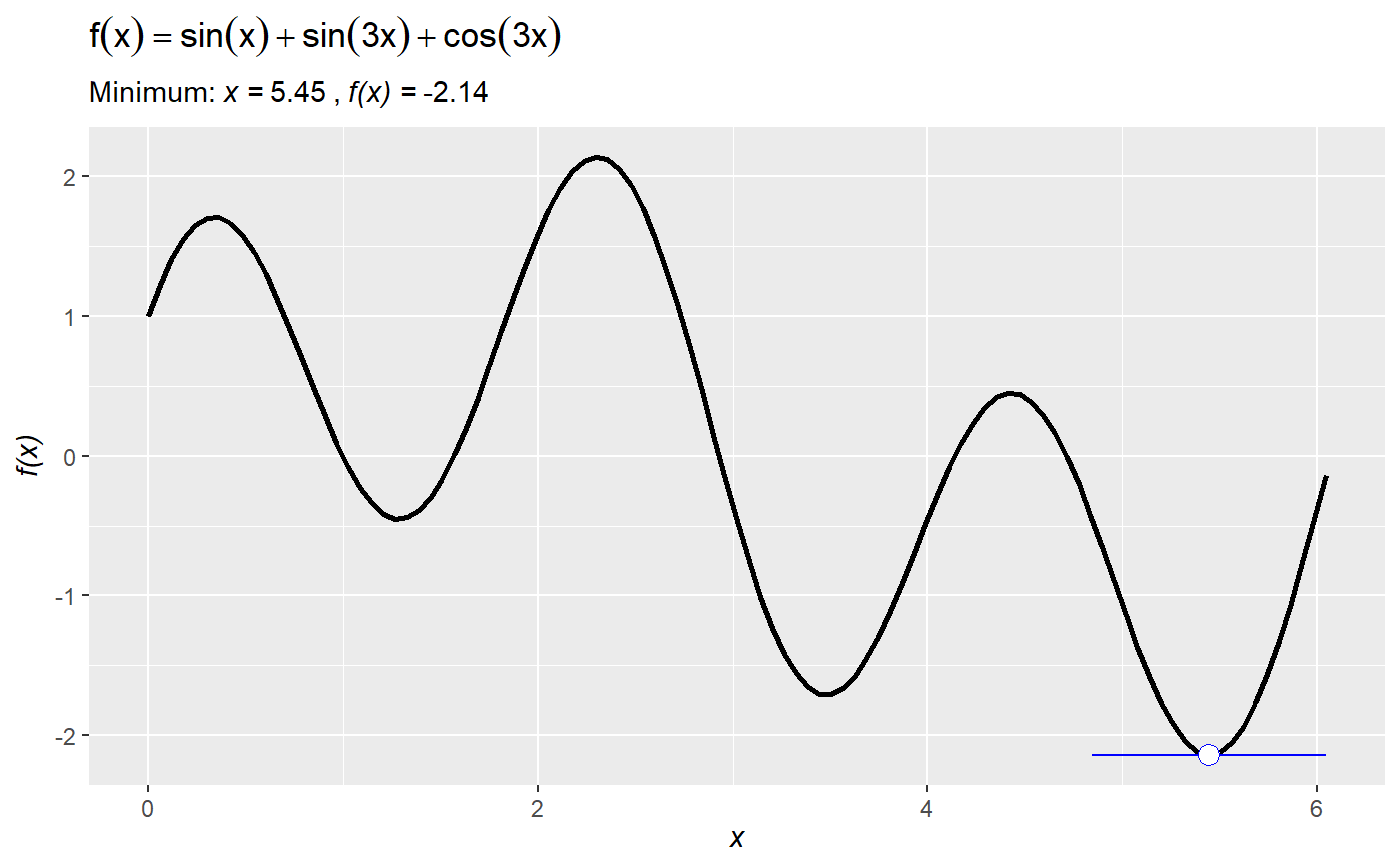
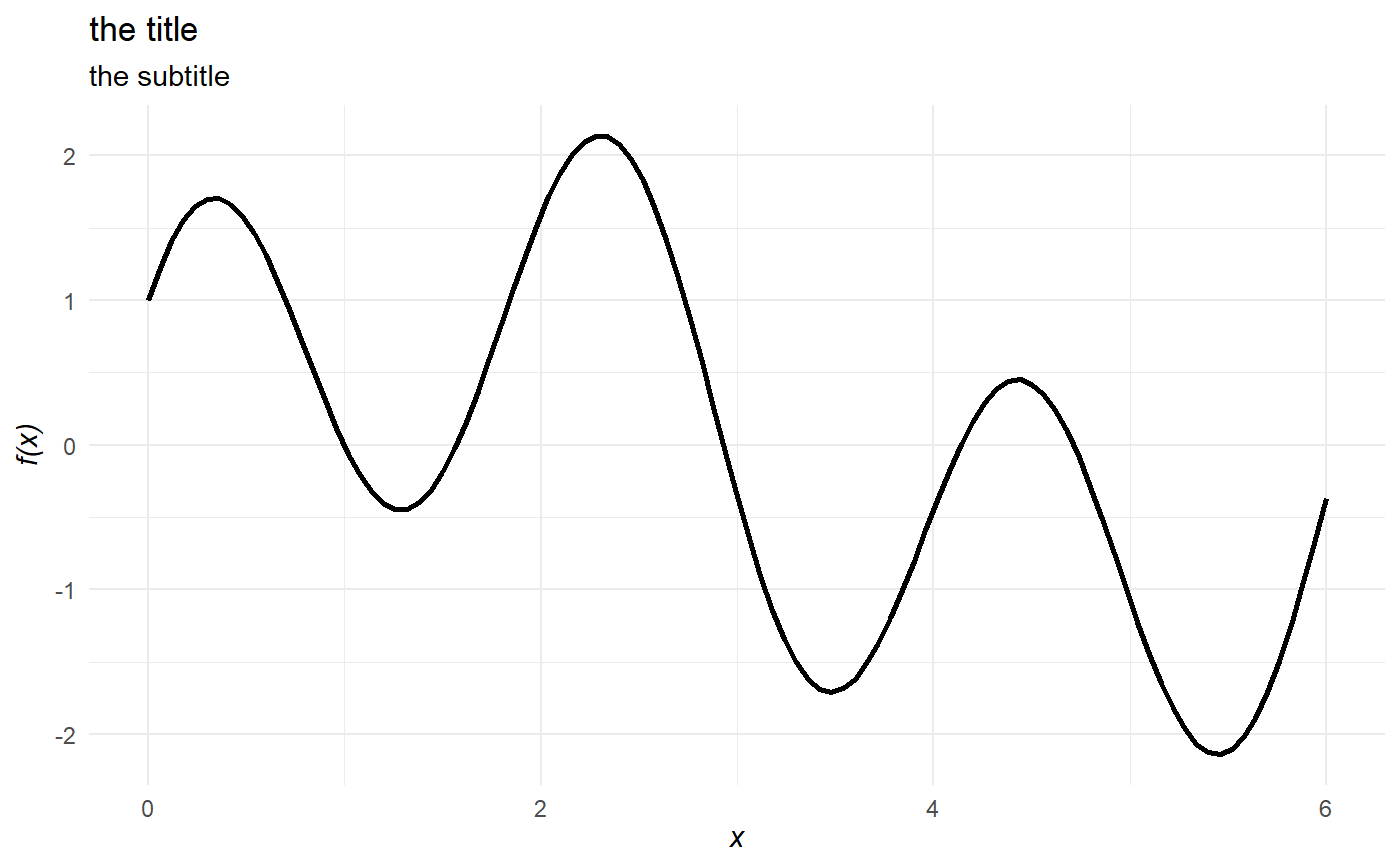
# declare some function ## right now the function needs to be declared on a single line f = function(x) -x^2 + 10*x # plot the function over the domain x = {0, ..., 10} plot_function(f, lower = 0, upper = 10)# calculate and show the global maximum over the domain. Default is minimization, so set maximum to TRUE: plot_function(f, lower = 0, upper = 10, optimize = TRUE, maximum = TRUE)# show that the optimal point occurs where the derivative is zero (i.e., the first-order condition): plot_function(f, lower = 0, upper = 10, derivative = TRUE, roots = TRUE)# you can also define an anonymous function (i.e., define a function on the fly *inside* `plot_function`): plot_function(function(x) sin(x) + sin(3*x) + cos(3*x), lower = 0, upper = 6)# and show all roots over the domain: plot_function(function(x) sin(x) + sin(3*x) + cos(3*x), lower = 0, upper = 6, roots = TRUE)# plot_function uses uses `optimize()` by default, which implements Brent optimization. # It can struggle to find local optima for messy functions. # For instance, it misses the local optimum: plot_function(function(x) sin(x) + sin(3*x) + cos(3*x), lower = 0, upper = 6, optimize = TRUE)# you can switch to `optim()` and then set the starting value `par` (from `optim`) to get better results: plot_function(function(x) sin(x) + sin(3*x) + cos(3*x), lower = 0, upper = 6, optimize = TRUE, optim = TRUE, par = 5)# since `plot_function` returns a ggplot object you can add ggplot stuff (e.g., change the theme, the titles, etc.) plot_function(function(x) sin(x) + sin(3*x) + cos(3*x), lower = 0, upper = 6) + theme_minimal() + labs(subtitle = "the subtitle", title = "the title")
