Plot random numbers from a distribution
plot_distribution.RdPlot random numbers from a distribution
plot_distribution(
  model,
  n = 1000,
  density = FALSE,
  cumulative = FALSE,
  distribution = NULL,
  details = NULL,
  fill = "grey35",
  color = "grey35",
  alpha = 1,
  ...
)
Arguments
| model | one of R's built-in probability distributions (e.g., 'rnorm', 'rpois', 'runif'). |
|---|---|
| n | number of observations. Defaults to 1000 |
| density | plot the kernel density estimates instead of the histogram. Defaults to FALSE. |
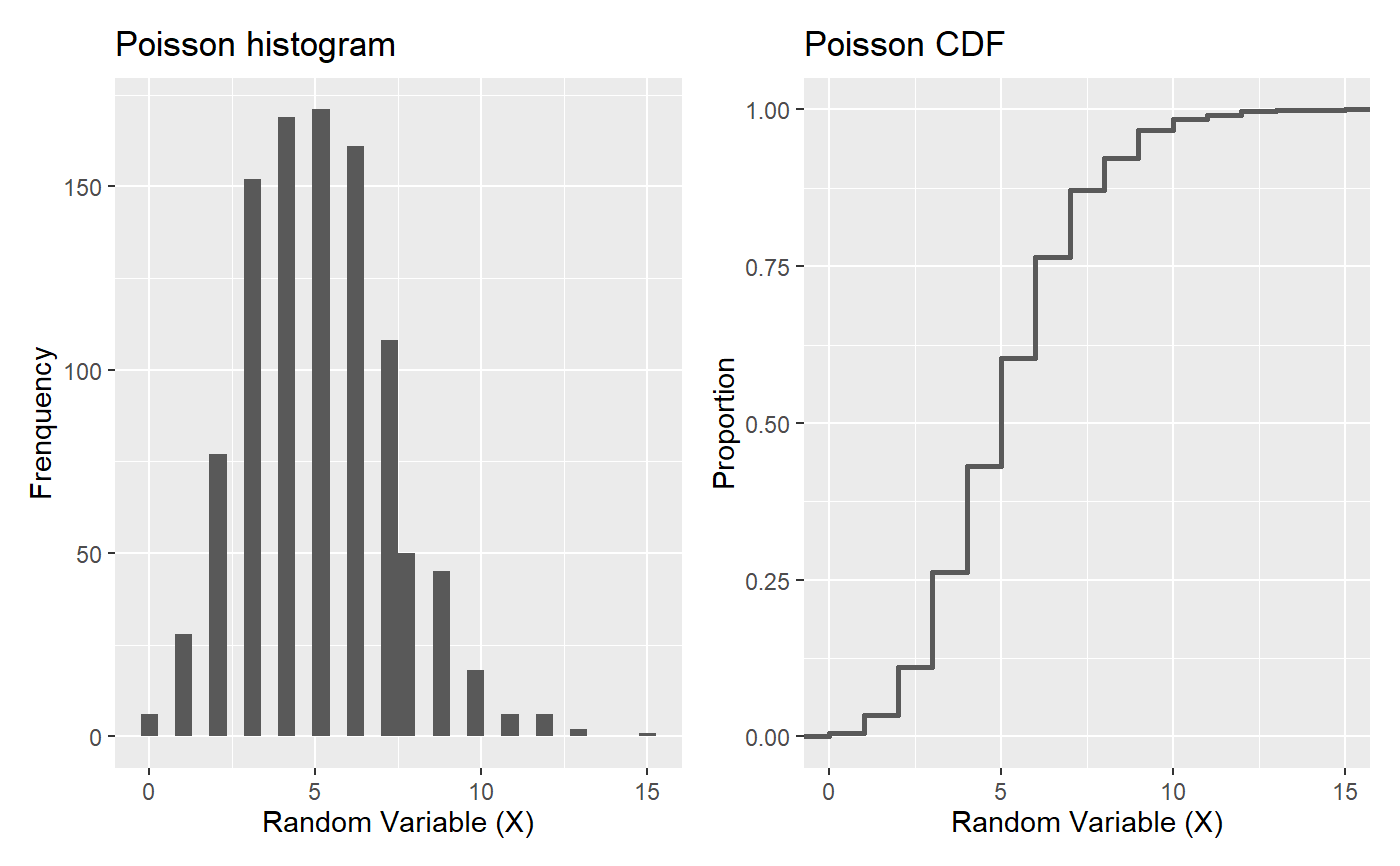
| cumulative | show the cumulative distribution as well as the PDF? Defaults to FALSE. |
| distribution | name of the distribution (a string). Used in the plot title(s). Defaults to NULL, in which case `model` is used in the plot title. |
| details | details about the distribution (e.g., mean and sd). Used in the plot subtitle(s). Defaults to NULL. |
| fill | fill color of the histogram or density. Defaults to "grey35" (the ggplot2 default) |
| alpha | transparency of the histogram or density. Defaults to 1 (no transparency) |
| ... | additional arguments passed to `model` (e.g. mean and sd for `rnorm`, lambda for `rpois`, etc.) |
Value
ggplot object
Author
Lawrence R. De Geest
Examples
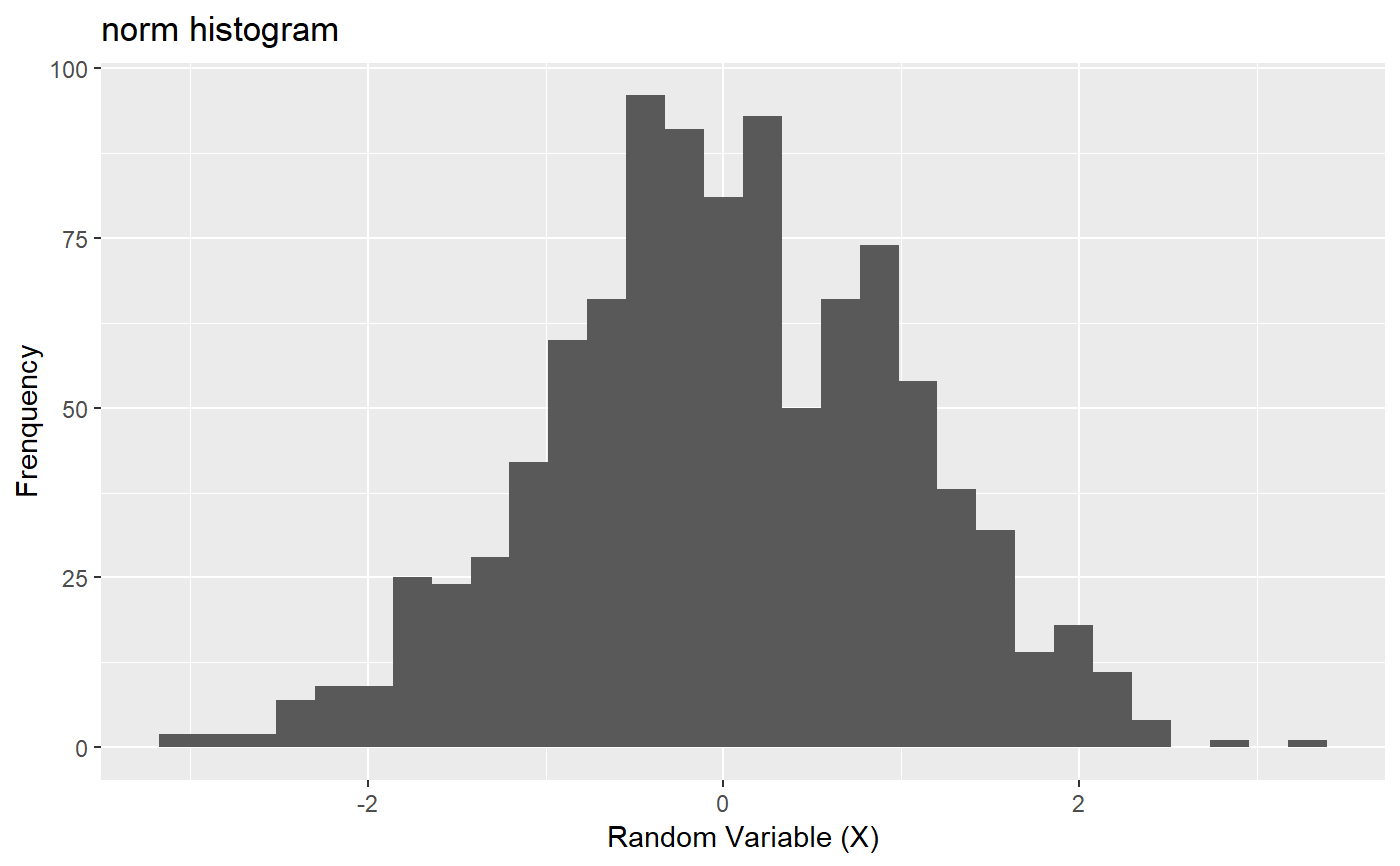
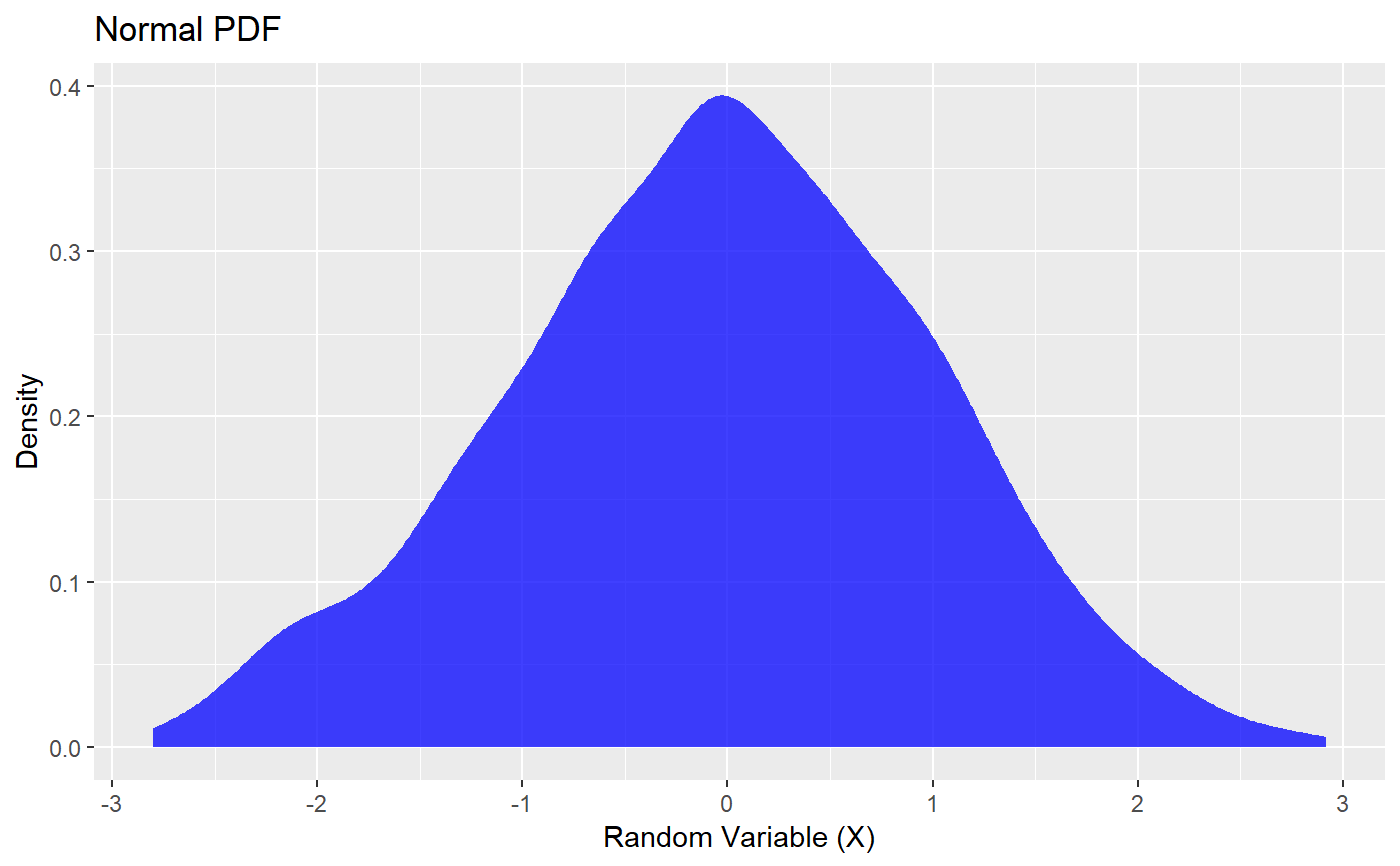
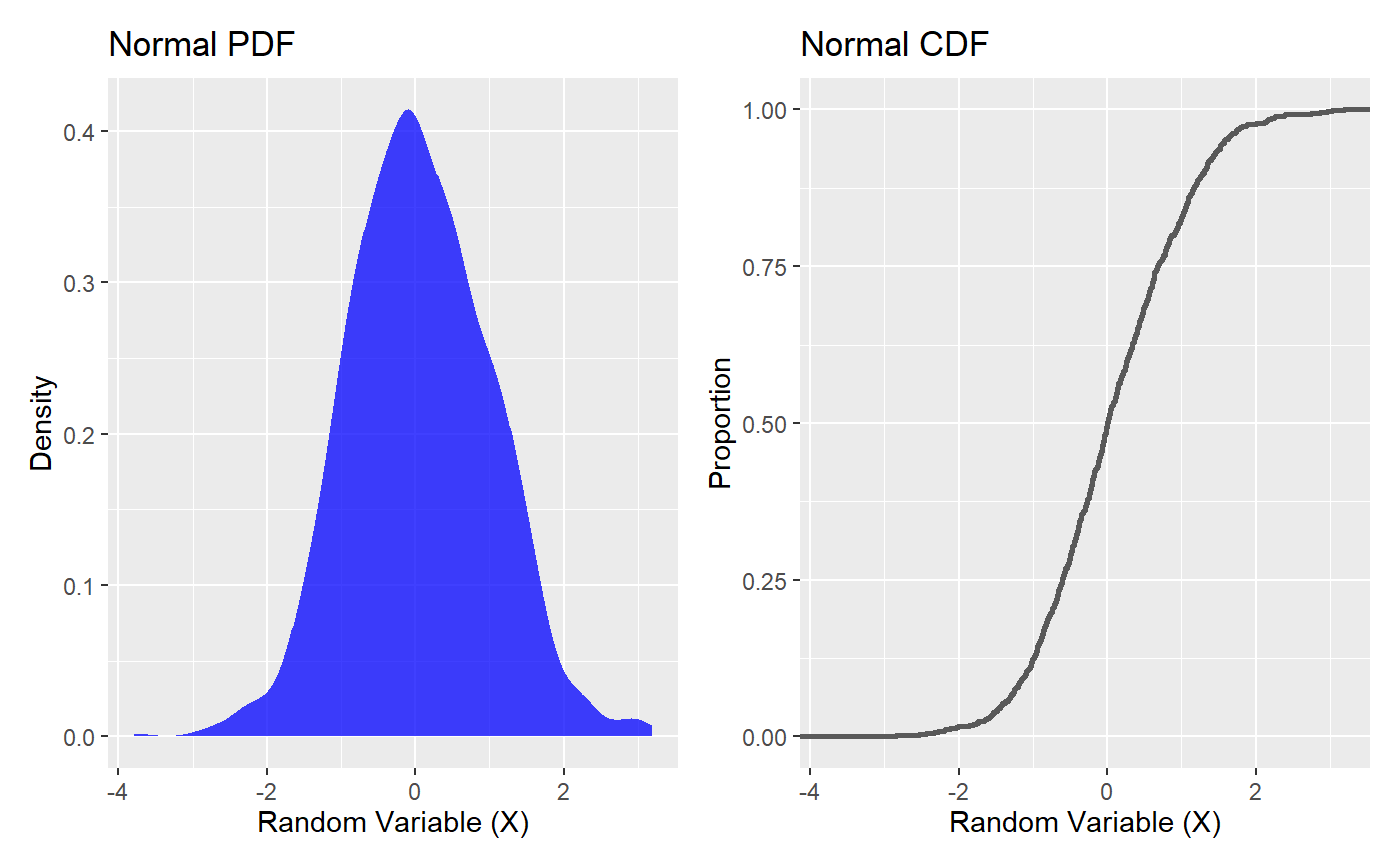
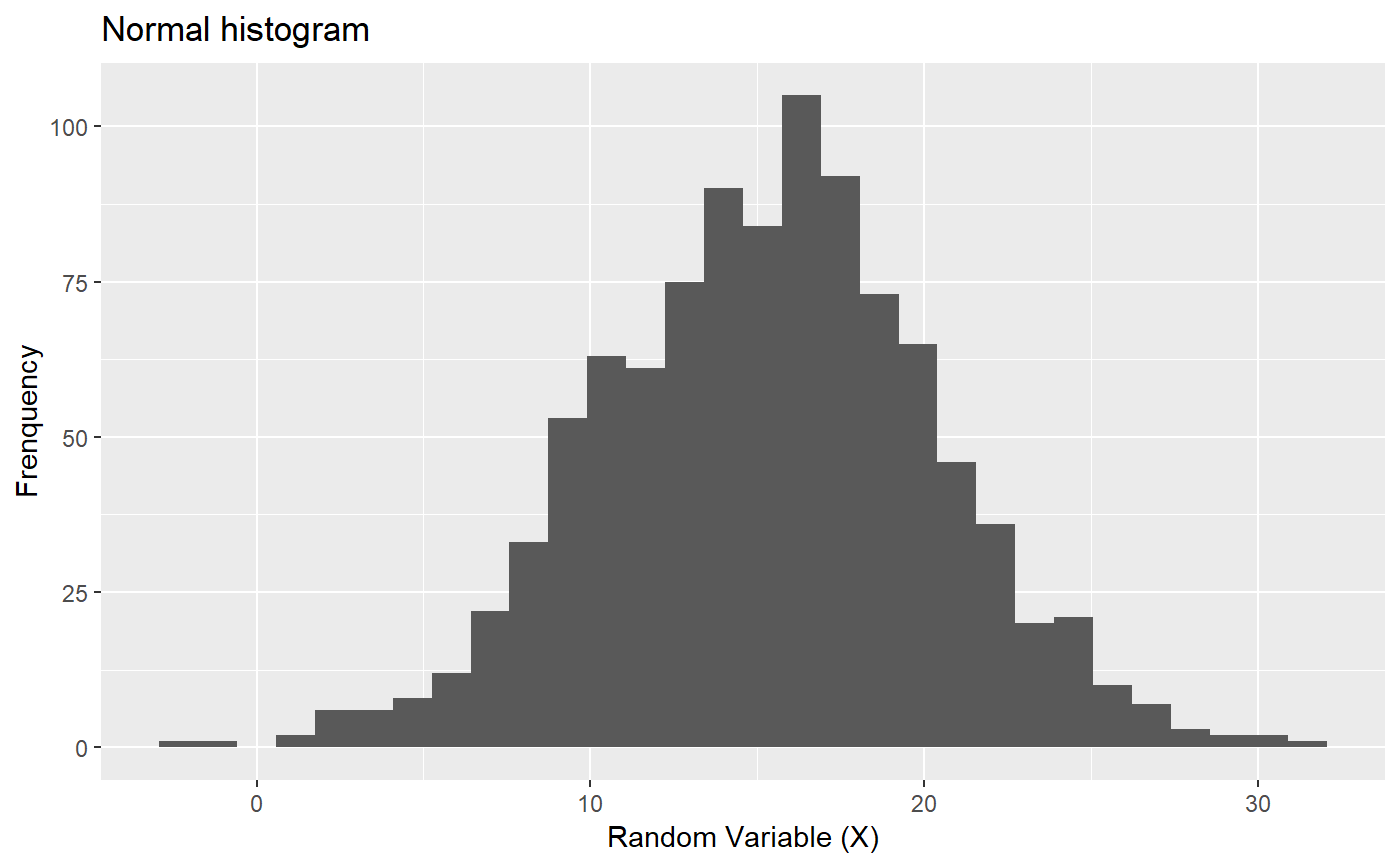
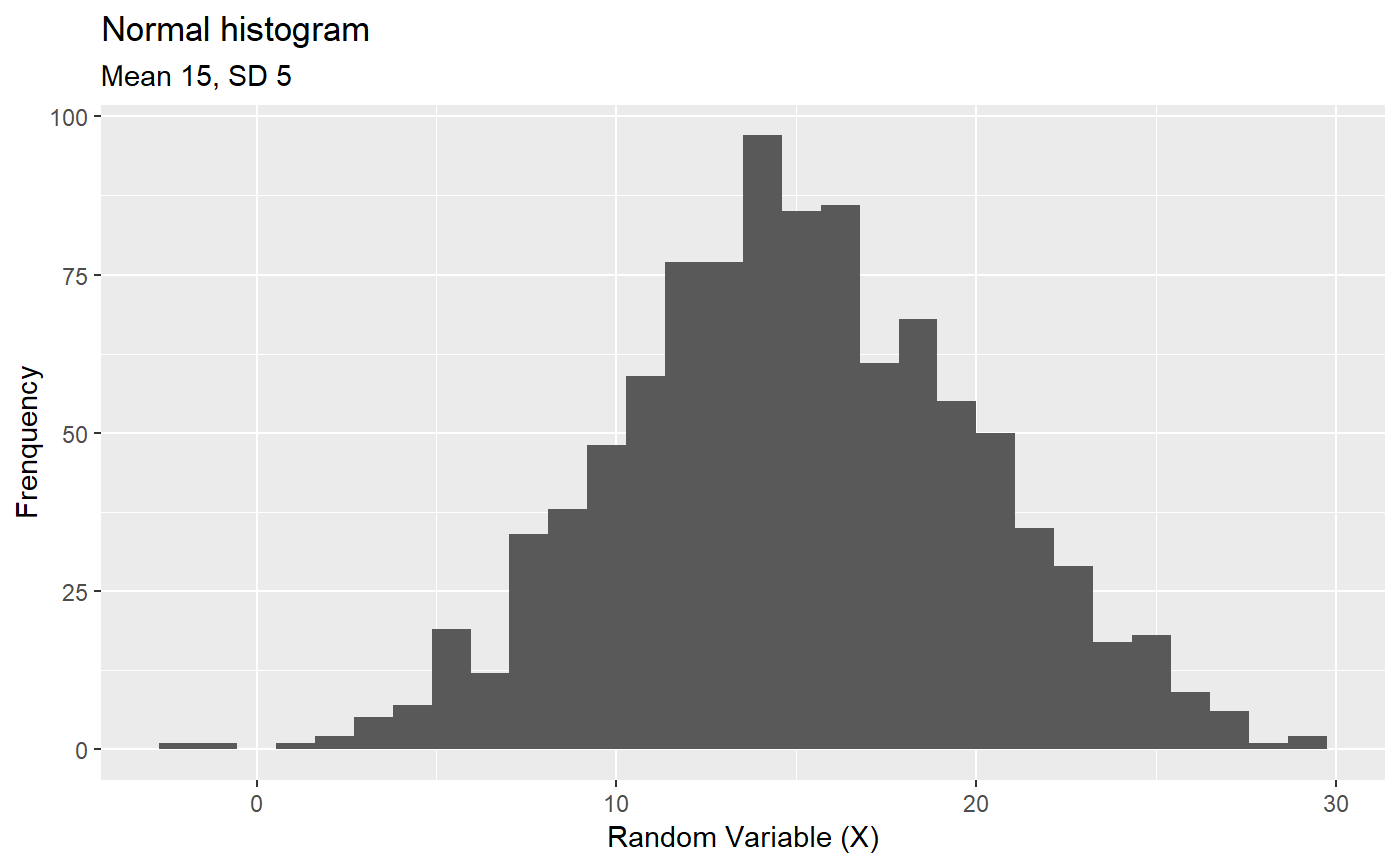
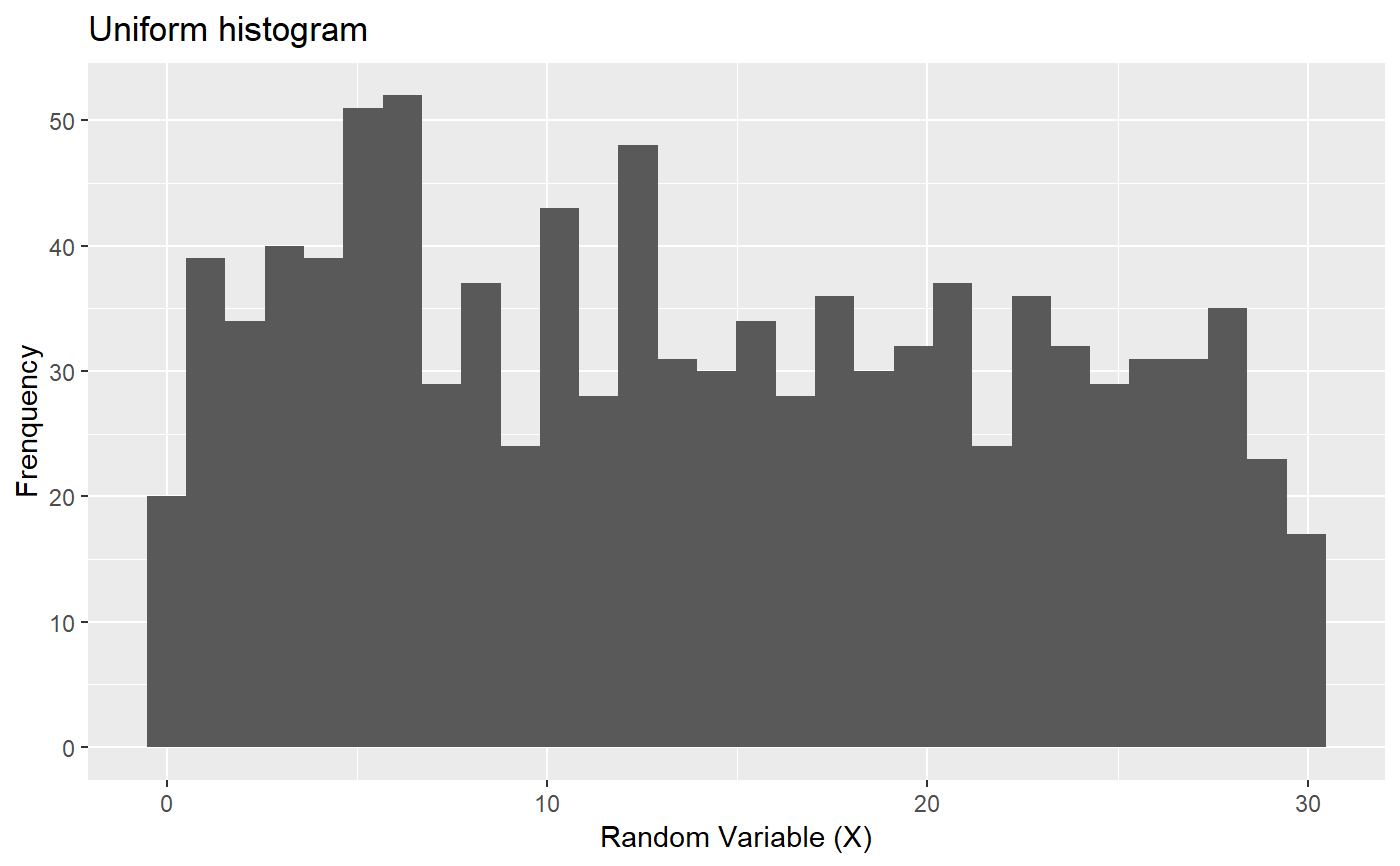
# plot the standard normal plot_distribution(model = 'rnorm')# plot the standard normal, but this time show the density, change the fill and transparency, and add a name for a nicer title plot_distribution(model = 'rnorm', density = TRUE, fill = "blue", alpha = 0.75, distribution = "Normal")# include the cumulative distribution plot_distribution(model = 'rnorm', density = TRUE, cumulative = TRUE, fill = "blue", alpha = 0.75, distribution = "Normal")# use ... to send additional arguments to `model`. # for instance, shift the distribution: plot_distribution(model = 'rnorm', mean = 15, sd = 5, distribution = "Normal")# use the details argument to make a subtitle with more details about the distribution plot_distribution(model = 'rnorm', mean = 15, sd = 5, distribution = "Normal", details = "Mean 15, SD 5")# uniform distribution plot_distribution(model = 'runif', min = 0, max = 30, distribution = "Uniform")# Poisson distribution plot_distribution(model = 'rpois', lambda = 5, cumulative = TRUE, distribution = "Poisson")